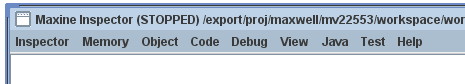
The Maxine Inspector
The Maxine Inspector is the essential all-in-one companion tool for Open Source Maxine VM development. It plays many roles:
- object, class, and method browser;
- code views include disassembled machine code, disassembled bytecode, and source;
- low-level debugger (imagine gdb or dbx) with visual displays of threads, registers, stacks, stack frames, thread local values, breakpoints, memory watchpoints, etc.;
- intermediate representation debugger;
- source-level Java debugger (eventually); and
- serviceability agent (eventually).
This short (5 minute) 2009 video describes the goals of the inspector and highlights some of the ways in which it makes Maxine VM development highly productive.
Please be aware that the Inspector is very much a work in progress, as is the Maxine VM itself. The two have co-evolved and will continue to do so as the design of the VM matures and the concerns of the developers expand. Functionality is constantly being improved and extended, so there are already places where the current system differs from what you will find here.
More discussion and more detailed documentation follows below.
Goals
In addition to enhancing the productivity of our own development team, the Maxine Inspector is part of our strategic goal of making VM experimentation more accessible to a wider audience. By leveraging the meta-circularity of the VM itself (and sharing a great deal of the VM’s source code), the Inspector makes it possible to visualize concisely many aspects of VM state that are elusive and widely distributed in other systems. These same advantages also make it possible to debug the VM with a single tool, highly specialized for this purpose.
Background and Rationale
Debugging virtual machines (VMs) presents unique challenges, expecially for a meta-circular VM, such as Maxine, that is self-implemented in the same language it implements. Making sense of Maxine’s runtime state requires interaction simultaneously at the source, bytecode, and machine code abstraction levels, and it must leverage knowledge of the VM’s design. Specific issues include:
- Maxine VM code must be largely optimized statically, not only for ordinary performance reasons, but also in order to be able to bootstrap the VM at all.
- Dynamic optimization at runtime can be applied to the VM’s own implementation, not just application code.
- Mapping optimized code locations back to bytecode and source locations is not generally possible without onerous limitations.
- Dynamically de-optimizing code for debugging can be effective for application code, but only when the VM can be assumed correct.
- Debugging the VM itself, however, requires scrutinizing its lowest-level, most optimized code representations and runtime machine state.
- Special considerations arise when debugging garbage collection, for example the Inspector’s dependence on the VM’s meta-information about classes, methods, etc., which are represented as ordinary Java objects in the heap; garbage collection, however, routinely breaks the heap invariants that make those objects accessible.
- Good debugging support is paramount for a VM intended for experimentation and fast prototyping.
- The Maxine Inspector addreses these concerns, supporting comprehensive inspection and interaction at all program representation levels.
- Finally, these services must be available to developers in a wide variety of contexts: examining a pre-execution boot image, examining and controlling a live VM process (local or remote), and post-mortem examination of a VM core dump.
Furthermore, the Inspector’s design exploits the fact that it is implemented in the same language that the VM implements and is implemented in; this gives rise to many code reuse opportunities. For example, the same mechanisms used by the VM’s boot image generator, which allow the creation of objects in the binary runtime format for a potentially different platform, can be used by the Inspector to examine binary runtime state for a potentially different platform than the Inspector’s host.
Downloading and Building the Inspector
The Inspector source code is part of the Maxine VM repository. It will download and build automatically with the rest of the Maxine code. See also Inspector-specific issues on various platforms.
A Tour Through The Maxine Inspector
The best way to learn about the Inspector (and about many aspects of the Maxine VM) is to start up the Inspector on a simple VM session. For a beginner’s introduction, however, the following pages introduce specific aspects of the Inspector’s operation, in some cases with short video segments. The topics are threaded in a sequence so that you can navigate through them in order if you are new to the Inspector.
Boot Image Configuration
A good introduction to some of the Maxine VM’s architectural features is provided by the Inspector command via the Boot Image info entry on any View menu. This produces an Inspector window displaying configuration parameters of the boot image being inspected. The boot image and its configuration can be inspected with or without a running VM process.
This short 2008 video demonstrates this view, although some evolution has taken place since then.
A more detailed description of the display appears below.
The Boot Image Inspector
The boot image contains several groups of configuration parameters, each of which relates to some aspect of the Maxine implementation. The Boot Image Inspector displays them in a simple tabular format, with entries in several general categories:
- Identification of the particular boot image build.
- Basic build options, e.g.
DEBUGorPRODUCT. - Target machine properties: the model, instruction set, word size, endianness, etc. for which code is compiled, both in the boot image and at run time.
- Operating System properties.
- Maxine schemes: pluggable modules that implement specific functions in the VM. For example, the grip scheme implements low level memory addressing, at which level garbage collection takes place; the run scheme directs what happens at VM startup, which could be running a standard Java program, as in the example, but could something else specified at build time.
- Parameters describing the boot heap: a pre-populated heap segment containing objects created at build time, in the same format as the dynamic heap segments created at run time.
- Parameters describing the boot code region of memory, which contains compiled code in the same format as the regions of compiled code that are created by dynamic compilation and recompilation at run time.
- Code entry pointers: specific addresses in the boot code region (displayed symbolically by the inspector in the example) for distinguished methods that will be called at VM startup.
- Distinguished object pointers: specific addresses in the boot heap
region for objects of importance at VM startup, for example the root
ClassRegistryobject (displayed symbolically by the inspector in the example).
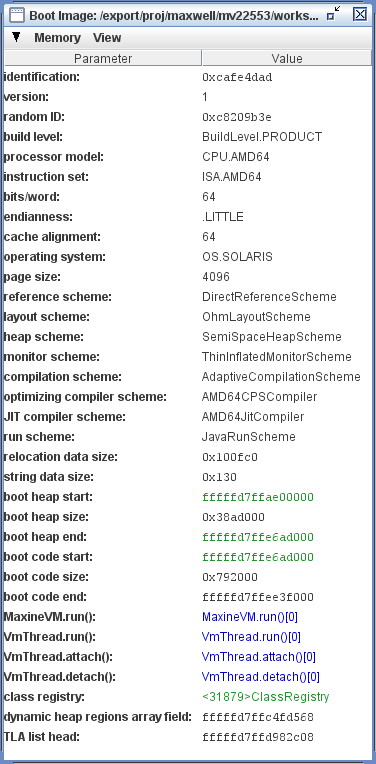
As with many data displays in the Inspector, the items in the Value column have additional useful behavior. For example, most provide additional information about the displayed value in a mouse-over “Tooltip” display that appears when the mouse hovers over the display. In simple cases, such as integers, the Tooltip might display the value in another base. For example the page size item displays in decimal by default, but the hexadecimal value appears in the Tooltip. Conversely, the boot heap size displays in hexadecimal by default, and the decimal value appears in the Tooltip.
Any display item showing a memory value that could be interpreted as a pointer to a memory location exhibits much more complex behavior, described in more detail in Memory Word Values.
The Inspector investigates each of these values empirically to determine where such a value might point in the VM’s current memory.
In the displayed example, the value of the parameter boot heap start was discovered to point at a heap object, presumably the first object in the region.
Although displayed in hexadecimal by default, the item is color coded green to reveal this fact, and an alternate display showing information about the object (for example the class registry pointer) might also appear by default.
Similarly, parameter named MaxineVM.run() was discovered to point to the compiled code for a specific method, in this case evidently the correct one; in the example, these are displayed symbolically by default.
These display items also exhibit dynamic behavior in response to various mouse actions.
For more detail, see Memory Word Values.
An optional Memory Regions Column is available by selecting the View Options entry from the View menu. This setting is persistent, and it can also be set as a User Preference.
Memory Word Values
Many Inspector views display values that represent the contents of a memory word in the VM. Such words might contain primitive data values, but they also might contain addresses that point to other locations in the VM’s memory such as heap objects and executable instructions. We call an Inspector element that displays the contents of a memory word a Memory Word Value. For example, in the Boot Image Inspector, shown here, of the parameter values in the lower part of the display are such Memory Word Values.
Memory Word Values are among the most important aspects of the Inspector, and they appear in almost every kind of view. They exhibit a variety of useful behaviors, described on this page, designed to make the Inspector as useful as possible.
Investigating memory references
A Memory Word Value is often bound to a specific word location in the memory of a running VM. After each VM execution cycle, the Inspector “refreshes” every Memory Word Value, which causes the value in each word to be from memory read again. Each time this happens, the Inspector attempts to relate the value found to other information that is already known about the state of the VM.
In many cases the Inspector can determine by context that a particular word value ought to or might point to some specific kind of location. In every case, however, the Inspector investigates the value of the word and determines empirically whether the value points to some known part of the VM state; this is essential for debugging the VM implementation, since those assumptions might not always hold.
Note that this investigation of memory word values can be suspended by turning off the persistent User Preference Investigate memory references. This does not, however, prevent the value from being read from memory at the conclusion of every refresh cycle.
Color-coding and mouse behavior
When a word value does not point to any known kind of location (for example the parameter boot code end in the Boot Image Inspector), the value is simply displayed in plain hexadecimal (alternate interpretations, for example decimal, are available in a mouseover Tooltip). When it does point to contents of a known kind, the display exhibits complex visual and interactive behavior that reveals what is known about the location to which the value refers. This list describes some of those behaviors:
- Color: The default display color of a Memory Word Value is black, but if something is learned about where the value points the following color code reveals the kind of data to which the value refers:
- green: points at a Heap Object.
- blue: points at a method entry for compiled Machine Code.
- pale blue: points into the interior of a method for compiled Machine Code.
- magenta: points into Thread Local Memory.
- red: points into memory not known to be in a Memory Region allocated by the VM.
- Numeric Display: A word of bits can be interpreted as several different types of numeric values. For example, floating point register values being displayed in the Registers Inspector can be displayed in three different formats: hexadecimal, as a float value, and as a double float value. As noted below, a mouse middle-click over such a Memory Word Value will cause it to cycle among its possible display states.
- Symbolic Display: Some values that point to known kinds of
information have two modes of display: numeric and symbolic.
The default mode depends usually on whether the Inspector assumes
from context that a particular value should point to something
known.
In the Boot Image display, the parameter
boot heap startis not assumed to point at anything in particular, but the Inspector has discovered that it points at a heap object. On the other hand, the parameterclass registryis assumed to point to a heap object, so the default display mode is symbolic. As noted below, a mouse middle-click over such a Memory Word Value will cause it to cycle among its possible display states. - Heap Object References: The symbolic display of a heap object
reference (for example, the value of the
class registryparameter) begins with an integer ID for the object that is unique for the duration of the inspection, followed by the type of the reference, displayed as an unqualified class name. A variant display appears for objects of Maxine’s low-level implementation types:<Maxine role>(<java entity for which the object plays this role>). Examples of such roles include Class Actor, Dynamic Hub, and Static Tuple. When a heap object reference is being displayed in numeric mode, symbolic information is among the extra information available as a Tooltip, and a mouse left-click will create a new Object Inspector on the object. - Machine Code References: The symbolic display of a word pointing at compiled machine code is displayed (for Java methods) as the unqualified class name, followed by the method name, followed by empty parentheses, followed by a compilation index in square brackets. The compilation index identifies which of the potentially multiple compilations of the method contains the reference location. When a machine code pointer is being displayed in numeric mode, symbolic information is among the extra information available as a Tooltip, and a mouse left-click will create a new Method Inspector on the object
- Left Mouse Button: A mouse left-click over a Memory Word Value creates an Inspector for what, if anything, is pointed to by the value. If the value is a heap object reference, it creates a new Object Inspector. If the value points into machine code, it creates a new Method Inspector displaying the disassembled Machine Code.
- Middle Mouse Button: A mouse middle-click cycles among the display states of the Memory Word Value under the mouse cursor.
- Right Mouse Button: A mouse right-click over a word value causes a menu of commands to be displayed. Some entries in the menu are universal, for example Copy Word To Clipboard. When display modes are available, the command Toggle Display Mode performs the same function as a mouse middle-click. Commands are available that create a Memory Inspector at the location specified by the word value. Yet other commands are sensitive to the particular kind of information pointed to by the value, for example commands associated with Java methods or with Constant Pool entries.
Tooltips
A “tooltip” is a display of a small amount of text that pops up temporarily when the mouse rolls over display element. In the case of Word Value Labels, tooltips display several kinds of useful information that complement the terse displayed text of the element. The duration of each tooltip’s appearance can be controlled by the User Preference ToolTip dismiss.
Most Word Value Labels in Inspector views appear in tables, which have a “cell” on each row under each column, and in these tables there is a strong convention for what tooltip text appears. The first line of tooltip text usually identifies the particular row under the cursor, and in particular the VM entity that is being portrayed by that row in the table. Examples include:
Object header field "MISC"Instruction 4 "mov"Thread local "MUTATOR_STATE
The remaining tooltip lines display additional information, possibly
redundant, about the cell under the cursor.
For example, a cell in the Value column of an
Object Inspector or
Memory Inspector whose memory word contains a
Reference, displays both the address in hexadecimal and a short
description of the referred to object, whereas the table cell itself
displays only one of these at a time, depending on its display state.
Furthermore, that tooltip also describes the memory region into which
the Reference points, something that is otherwise visible only by
activating a separate column in the view.
Cells in a Name column add to the tooltip any of the short
“description” strings associated with some Maxine VM internal
entities.
For example, this string describes the purpose of a VM thread local, and
it appears with the tooltip over its name in the
VM Thread Locals Inspector.
Cells in the Tag column of any memory-based Inspector view will
display tooltip text (following the line 1 descriptor) that describes
(a) the registers, if any, that point into the row’s memory region, (b) the watchpoints, if any, that are set in the row’s memory region, and
(c) the watchpoint, if any, that is currently triggered on a location (specified) in the memory region. Some of this information is redundant, since a special cell border reveals the presence of a watchpoint, a special icon and color reveals the location of a triggered watchpoint, and the cell’s text lists any registers pointing into the region. Some is not, however, for example the specific address information at which a watchpoint trigger occurred; this information is otherwise only visible in the Watchpoints Inspector.
The specific kind of additional information that appears is quite
dependent on context: on the particular column (Value or Address),
on an expectation about the value (e.g. “should contain a Reference”),
and the actual value discovered in VM memory. This overall approach is
designed to offer:
- verbosity and redundancy for the beginner (and sometimes for the pro), and
- additional information for the pro, information that can reduce jumps to another view and reduce the number of columns visible (which in turn frees visual space for other information).
Drag and drop
A Memory Word Value display can also act as the source of a Drag & Drop operation. If the value points into a known region of memory, dragging the value away from the display and dropping it onto the Inspector’s background window will produce a Memory Inspector whose display begins at that address.
The Memory Inspector
Most of the views provided by the Maxine Inspector display something about the state of the VM that has been read from memory as raw bytes and then been interpreted in useful terms, based on the Inspector’s embedded knowledge of the VM’s design. Many such views are described in subsequent sections.
Sometimes, however, it is important to display memory at a very low level, without assumptions about content, and the Maxine Inspector offers low-level views for this purpose.
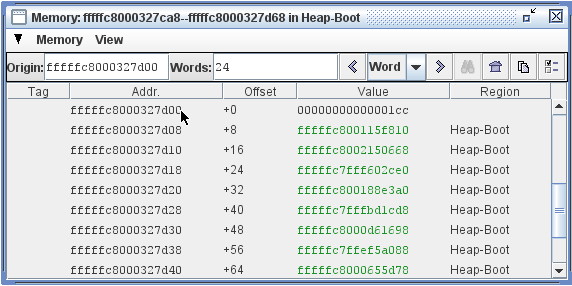
default “Word” mode
An Inspection session can contain any number of Memory Inspectors. The default behavior of a Memory Inspector is demonstrated by the example to the right. The specified range of memory being displayed appears in the window header, along with the name of the allocated Memory Region in which the first word lies. The memory in the specified range appears, grouped by word, one word per row, using the default columns that appear in the example:
- Tag column: a place where additional information about the memory word can be displayed. For example it displays the names of any registers in the currently selected thread that point at the location. The Tag column also highlights any word where a Watchpoints is set. Many Inspectors have a similar Tag column.
- Addr. column: the location of the first byte in the word, expressed as a hexadecimal memory address.
- Offset column: the location of the word, specified as the number of bytes offset (either positive or negative) from the current origin of the Inspector (more about the origin follows below}.
- Value column: The contents of each word are read from the VM memory each time the VM halts. The values are displayed with numerous visual and interactive behaviors that depend on the value and the context of their appearance. See Memory Word Values for details.
- Region column: displays the name of the Memory Region, if any, into which the value currently stored in the word points. See Memory Regions Column.
A Memory Inspector can be created in several ways:
- The Inspect memory at address… entry in the standard Memory menu brings up a dialog in which a starting address for a new Memory Inspector may be entered.
- The Inspect this object’s memory entry in the Memory menu appearing on any Object Inspector.
- Clicking on the Create cloned copy… button in the tool bar of any existing Memory Inspector; this creates a new Memory Inspector whose location is identical to the original, but whose subsequent behavior is independent of the original.
- Dragging any Memory Word Value to the Inspector’s background; if the value can be interpreted as a memory location known to be allocated, a new Memory Inspector will be created started at that location.
- Dragging the display of any Memory Region name (for example, any name displayed in a Memory Region Column) to the Inspector’s background; a new Memory Inspector will be created whose display spans the entire region.
Note that the Memory Inspector depicted in this example is currently in Word mode, as indicated by the pull-down selector in the Inspector’s tool bar. In this mode the Back and Forward arrow buttons serve to relocate the viewing region of the Memory Inspector forward or backward one word at a time. The operation of the arrow buttons in other modes (Object and Page modes) is discussed in subsequent sections. Navigation also takes place in response to the scroll bar and by resizing the window.
origin
Every Memory Inspector maintains a current origin at all times; this
is a word-aligned memory address from which the locations displayed in
the Offset column are computed.
When a Memory Inspector is created, the origin is set initially to the
first word of the memory being displayed, but the location of the origin
is thereafter unconstrained.
Commands in the Memory Inspector’s View menu, or direct editing of the
Origin field, allow the origin to be set elsewhere.
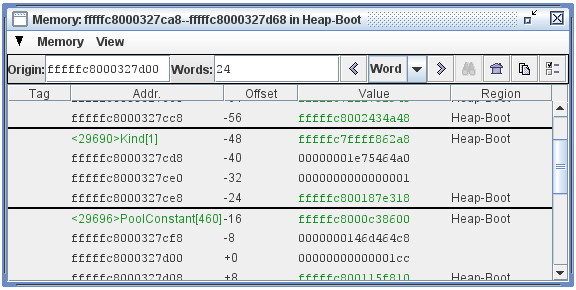
In this example, the displayed memory region is the same as the previous example, but the origin has been set to a location in the middle of the displayed region.
This example also shows the graphical separators that are applied by the Memory Inspector whenever it discovers Heap Object boundaries in VM memory.
“Object” mode
Navigation in the Memory Inspector is modulated by the mode currently selected via a pull-down selector in the Inspector’s tool bar, located between the Back and Forward arrow buttons.
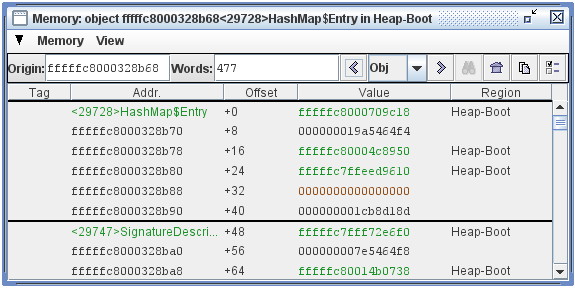
In this example the mode is set to Object, which causes the Back and
Forward buttons to move backward and forward one object at a time,
assuming any objects can be located.
Each Object-mode move resets the Inspector’s origin to the first word of
the object’s representation and scrolls until that position is in the
first viewing position.
These moves do not change the size of the region being displayed, nor do they cause the window to resize around the current object being displayed.
“Page” mode
Navigation in the Memory Inspector is modulated by the mode currently
selected via a pull-down selector in the Inspector’s tool bar, located
between the Back and Forward arrow buttons.
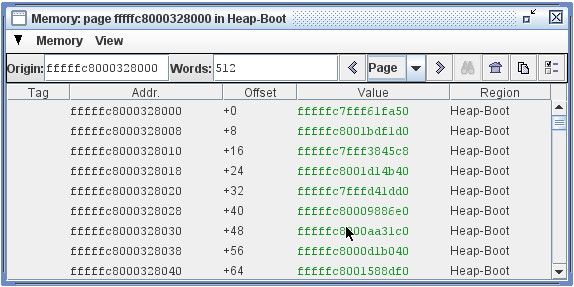
In this example the mode is set to Page, which can be very helpful
when working on page-based mechanisms in the VM, for example garbage
collection.
In this mode the size of the region is constrained to equal the page
size of the platform, and the origin is constrained to location at page
boundaries.
Navigation via the Back and Forward buttons relocates the viewing
region by one page per click.
Manually changing either the Origin or Words size fields causes the
mode to revert to Word.
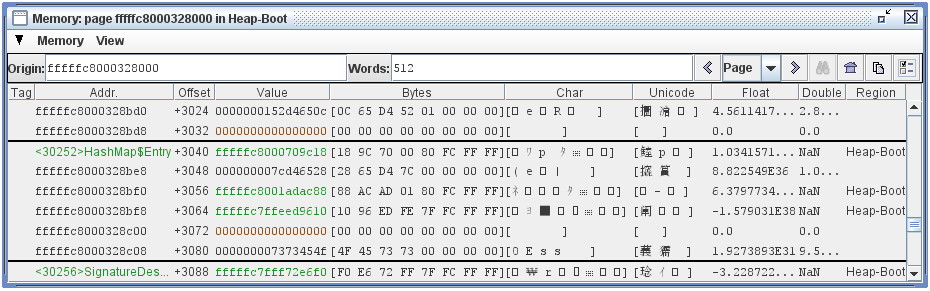
View options
The Memory Inspector provides a number of options for displaying word contents under different interpretations, available via the View Options entry in the Inspector’s View menu. The options dialog can also be invoked by clicking on the rightmost button in the tool bar.
In the example below, all optional columns are displayed. Each column displays the memory contents under a different interpretation: as Bytes, as Chars, as Unicode, as a single-precision Float, and as a Double-precision float.
The Memory Bytes Inspector
There are times when low-level memory inspection in terms of words, the only mode supported by the standard Memory Inspector described above, is not flexible enough for the task at hand. In these situations the Memory Bytes Inspector, shown in the example to the right, offers a much more flexible alternative.
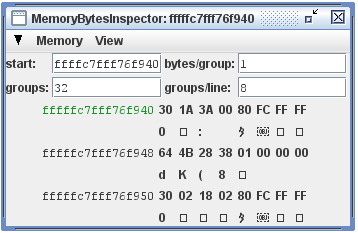
This Inspector can be configured to display memory at any location (address, length), and can display memory in any grouping of bytes.
In the special case where bytes appear in groups of 1, as in the example, each byte is also interpreted as an ASCII character. In the special case where bytes appear in groups of 2, each group is also interpreted as a UNICODE character.
In the special case where the address of a byte group is determined empirically to be a valid reference to either a heap object or code, this information can be displayed symbolically. In the example at the right, the Memory Bytes Inspector has observed that the address of the first group points to an object and has color coded the display to indicate that. See Memory Word Values for more details.
A Memory Bytes Inspector can be created in several ways:
- The Inspect memory bytes at address… entry in the standard Memory menu brings up a dialog in which a starting address for a new Memory Bytes Inspector may be entered.
- The Inspect memory at Origin as bytes entry in the View menu appearing on any Memory Inspector.
- A right mouse-click over the Tag column in most memory-based views will produce a popup menu, one entry of which is Inspect this memory as bytes.
Memory Regions
The Maxine VM allocates memory in regions dedicated to various subsystems. These regions are given names for the purposes of inspection, and the Inspector provides two mechanisms for observing this aspect of of the VM’s runtime state: the Memory Regions Inspector and the Memory Regions Column, which can be optionally displayed with many of the other Inspector Views.
The Memory Regions Inspector
The Memory Regions Inspector displays a tabular summary of every currently allocated region of memory in the running Maxine VM, with the following columns displayed by default:
- Tag: a place where additional information about the memory region
can be displayed.
In the example to the right the Tag entry in the second row notes
that register R14 currently points into the region
Thread-2 Locals. The Tag column also highlights any memory region where one or more Watchpoints are set. Many Inspectors have a similar Tag column. - Name: a human readable name that describes its purpose. In the example the two regions named Heap-Boot and Heap-Code are preconfigured as part of the binary boot image (see Boot Image Inspector), each in the runtime format of the dynamic heap and code regions respectively. Additional regions are allocated dynamically for code compiled at run time, for example the region named Code-Runtime. Specific heap implementation allocate memory according to a garbage collection scheme, for example the Heap-From and Heap-To regions allocated by a semi-space collector. Finally, a region of memory for the VM’s internal Thread Local Storage is allocated for each thread, named after the particular thread’s ID.
- Start, End: location of the region, expressed as hexadecimal memory addresses.
- Size: number of bytes contained in the memory region, expressed by default in headecimal, but with additional formats available in mouseover Tooltip text.
- Alloc: the percentage of the region that has actually been used by the particular subsystem owning the region, if this can be determined.
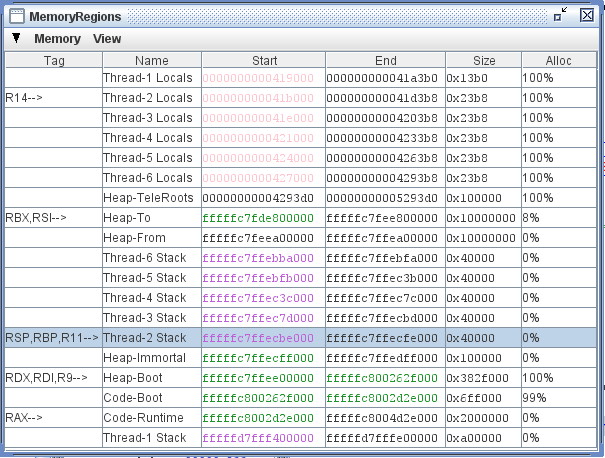
In the special case where a Start or End address is determined empirically by the Inspector to be a valid reference to known kinds of information, this information can be displayed symbolically. In the displayed example, the addresses colored green have been determined to point at heap objects, and the addresses colored magenta have been deteremined to point into thread local storage. Additional behaviors are available at such address display: mouseover Tooltips, mouse left-click, and mouse right-click (all of which are described in more detail in the field values section for Heap Objects).
Dragging a hexadecimal address from the Start or End columns onto the Inspector background causes a Memory Inspector to be created starting at that location and having a small default display span. Dragging a name from the Name column causes a Memory Inspector to be created whose span is the entire extent of the region.
The Memory Regions Column
Most Inspector views offer multiple columns of display information, only a few of which may be visible by default. The View Options menu item, available in the standard View menu, allows user selections of visible columns. This setting is persistent, and it can also be set as a User Preference.
Every Inspector that display memory values of any kind offers an optional column with the title Region. In the example to the right, the Registers Inspector is shown with the Memory Regions Column visible.
The Memory Regions Column display is based on a Memory Word Value associated with the particular row. If the Word Value is determined to point to a valid location somewere in the runtime state of the VM, the name of the memory region into which it points is displayed. If the Word Value does not point into a valid memory location, or if it is a different kind of value display, then the The Memory Regions Column is blank.
In the example several of the Word Values point to heap objects: some to objects in the Boot Heap memory region (see Boot Image Inspector), and some to the dynamic heap region Heap-To allocated by the semi-space garbage collector, one of several implemented in the Maxine VM. Some values point into the VM’s allocation for particular threads. Finally, the RIP register, which is assumed to point into executable code, does indeed point into a compiled method, as shown by the display in symbolic mode.
Dragging a hexadecimal address from the Value column onto the Inspector background causes a Memory Inspector to be created starting at that location and having a small default display span. Dragging a name from the Region column causes a Memory Inspector to be created whose span is the entire extent of the region.
Heap Objects
A Maxine Object Inspector displays the contents of a single heap object
as a sequence of name/value tuples with additional display
options.
Variant object representations in the VM are displayed with slightly
different kinds of Object Inspectors: tuples (ordinary objects), arrays,
and a special hybrid object used in the VM implementation that cannot be
expressed as a Java type.
Furthermore, certain common types can be displayed in multiple modes,
for example the contents of a char[] might alternately be displayed as
a string.
View a short demo here, or see below for examples and discussion of the heap object inspector’s behavior.
Note that the design of Heap Object Inspectors has changed since the demo video. There are many additional display features and options.
Inspecting tuple heap objects
Ordinary objects are referred to as Tuples in the Maxine VM
implementation The first example window at the right displays the
contents of a simple object of type
com.sun.max.vm.heap.BootHeapRegion.
The object is visualized as a simple list of Field/Value tuples.
In this example, all other view options for the objects are turned off.
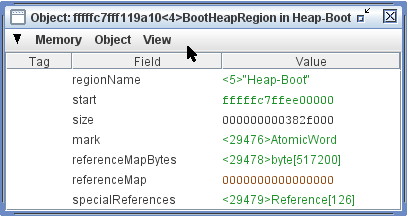
A basic Heap Object Inspector such as this one displays the following elements of a tuple:
- Title Bar: The window frame displays a compact string identifying the object: absolute address in memory, an integer ID for the object that is unique for the duration of the inspection, followed by the type of the object (as an unqualified class name) and the Memory Region in which it resides.
- Menu Bar: The Standard Menus relevant to the Object Inspector.
- Tag column: The Inspector annotates each field with meta-information that may relate to other aspects of VM state or to the interactive state of the inspection session. For example, an annotation lists the names of all machine Registers in the currently selected thread that point at the location represented by the row. A graphical annotations marks the locations of active Watchpoints for debugging. A mouse double-left-click in the Tag column toggles on and off the watchpoint at the specified location. A mouse right-click in the Tag column displays a menu of actions relevant to the specific memory location.
- Field column: All fields in the object, local or inherited, appear one per row, with the unqualified field name appearing in this column. A mouseover Tooltip reveals the type of the field and the class in which it is declared; both names in the ToolTip are fully qualified.
- Value column: The contents of object fields are read from the VM memory each time the VM halts. The values are displayed with numerous visual and interactive behaviors that depend on the value and the context of their appearance. See Memory Word Values for details.
Ordinary Java object, such as the one in this example, are represented in the Maxine VM heap as Tuples. There are two other general kinds of objects in the Maxine heap, for which Object Inspector behavior differs somewhat, as described below: Arrays, corresponding to ordinary Java arrays, and Hybrids, types specialized for the Maxine VM implementation that do not correspond to any Java type.
Object Inspector view options
View options are available available by selecting the View Options entry from the View menu. A dialog permits the request for additional kinds of information, either for the current Object Inspector only or for all subsequently created Object Inspectors. The setting for all subsequently created Object Inspectors is persistent, and it can also be set via the Preferences action (see User Preferences). The following example displays a heap object of type BootHeapRegion with all view options turned on.
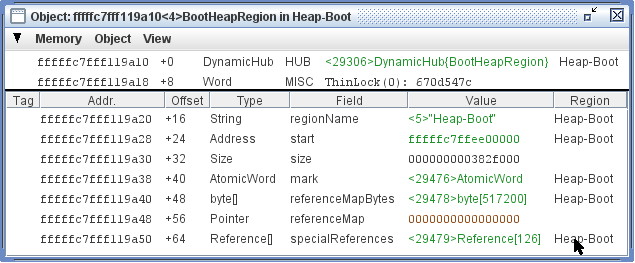
This example displays the same object as the previous example, but with every kind of optional view information enabled. These are listed below, not including the basic display features already described above.
- Object header: The Maxine VM implementation of heap objects adds an additional two or three fields in the object representation’s header. In the case of simple objects such as this one, the two fields include a reference to the Maxine information (represented as Java objects) concerning the class of the object, followed by a word of bit fields used for a variety of purposes, including locking. A third, when present, specifies the length of the array part of an object (see Array Objects) and Hybrid Objects below).
- Addr. column: displays the absolute current location of the field in VM memory, which may change when the heap is managing by a copying garbage collector. A mouseover Tooltip over this column displays the field’s offset from the beginning of the object, the same information displayed in the Offset column. A mouse right-click over an address produces a menu with standard commands for copying the value onto the clipboard and creating a Memory Inspector at this location.
- Offset column: displays the field’s location relative to the origin of the object, where the object layout is determined by a Maxine scheme. In this example, the object layout assigns the origin to memory location 0 in the representation of the object. A moueover Tooltip displays the field’s absolute memory location, the same information displayed in the optional Addr. column. A mouse right-click over this column produces a menu with standard commands for copying the value onto the clipboard and creating a Memory Inspector at this location.
- Type column: displays the Java language type of the value, expressed as either Java primitive type names or unqualified Java class names. Mouseover Tooptips display symbolic information about the Maxine implementation of the type. A mouse right-click produces a menu of commands for inspecting Java objects related to the Maxine implementation of the type.
- Region column: displays the name of the Memory Region, if any, into which the value currently stored in the field points. See Memory Regions Column.
Dragging a hexadecimal address from the Addr. column onto the Inspector background causes a Memory Inspector to be created starting at that location and having a small default display span. Dragging a name from the Region column causes a Memory Inspector to be created whose span is the entire extent of the region.
Arrays
The Object Inspector displays slightly different information for objects that the VM uses to represent Java arrays, as shown in the example. This Inspector displays an integer array of length 11; a scroll bar would appear when array length exceeds the size of the view window.
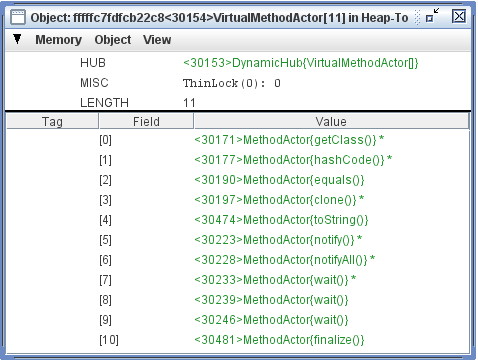
Array values are displayed exactly as for field values in ordinary tuple
objects: as Memory Word Values.
In the example, the values are references to objects of type
MethodActor.
This display differs from an ordinary Tuple Object Inspector in two ways. First, the object header contains a third field that holds the length of the array. Second, the Field column identifies the index of each array element.
A mouse double-left-click in the Tag column sets a watchpoint at the specified array element.
Other than the object header, all view options are turned off in this display. Standard view options are available for Addr., Offset, Type, and Region column. These options are similar to the View Options available for ordinary tuple objects and are available under the View Options entry in the View menu.
An additional view option is available for array objects: suppressing
the display of null elements, where the definition of null depends
on the particular element type.
This can greatly improve visualization of sparsely populated arrays.
Hybrid objects
For performance reasons, the Maxine VM stores much of its class-specific implementation metadata in a special kind of heap object that has no counterpart in the Java language. These objects are hybrids: they contain fields, as with an ordinary tuple object, but they also contain arrays dedicated to implementation data that must be efficiently accessed when examining the representation of an object.
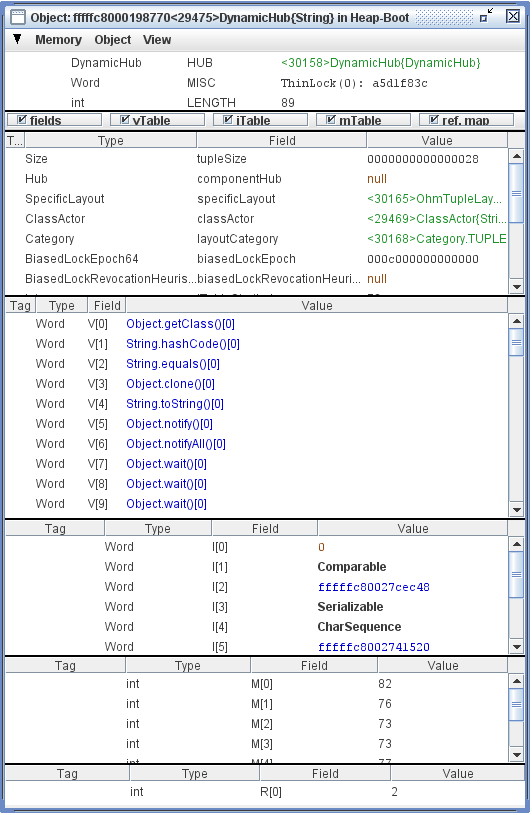
Each ordinary object’s header, as shown in earlier examples above,
contains a pointer to the object’s Hub, which is implemented in the heap
as a Maxine hybrid object.
The example shown to the right is a hybrid object representing the
Dynamic Hub for objects of type java.lang.String.
Every String object in the heap contains a pointer to this hub.
Each class at runtime also contains static values, represented as an object of the special type StaticTuple, whose metadata is contained in an object of type StaticHub, also represented as a hybrid object.
Note in passing the following circularity: the Hub pointer of a
DynamicHub points to the DynamicHub for class DynamicHub.
Reflecting the complexity of hybrid objects, the Object Inspector displays a hybrid as a collection of segments, each with different kinds of information.
- As with Array Objects, hybrids contain a word in the header that contains the total length of the array part of the object.
- As with Tuple Objects, hybrids contain named fields, displayed in the fields segment of the Object Inspector.
- The array segment of a hybrid us used to represent four kinds of
information, and the Object Inspector displays each separately:
vTable,iTable,mTable, andReference Map. Each array segment behaves as for Array Objects. - Each array segment is individually scrollable, and each can be either displayed or hidden by using checkboxes at the beginning of the Object Inspector.
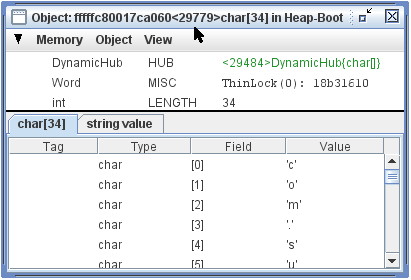
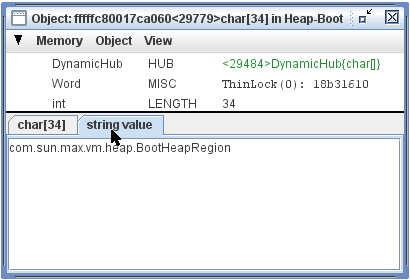
Specialized Object Inspectors
The Object Inspector can be specialized by adding alternate displays for heap objects of particular types. Several are currently in place, most of which display a textual summary of the object’s contents.
In two examples shown, a char array is shown to have such a specialized alternate configured, evident by the appearance of window tabs that select the display. The standard array display appears in the upper example, while the textual summary appears in the lower example.
Object view canonicalization
In ordinary operation, the Inspector creates at most one Object Inspector per unique object in the VM’s heap. A user request to view an object, for example by clicking on a value field that points at an object (see [Memory Word Values|Inspector-Memory Word Values), will cause a new Object Inspector to be created only if one does not already exist; if one does exist, it is simply brought forward and into full view. The determination is made by comparing the memory location of the two potentially identical objects.
In some situations, however, especially during garbage collection, the Inspector may not be able to make this determination identity correctly. For example, a relocating garbage collector may create a copy of an object’s representation, and this relationship may not be detectable immediately. The Inspector is designed to sort this out as much as possible, most importantly by stopping the VM at the conclusion of each GC cycle and reviewing reviewing for duplications its table of VM heap objects.
This is work in progress, and the Inspector may not always get identity sorted out correctly in every situation for every implementation of garbage collection.
Machine Code
A Maxine Method Inspector displays code associated with a method body in several ways. Here we show how machine code can be disassembled and displayed with useful interactive behavior.
View a short demo here, or see below for a discussion and screen snapshots of the Machine Code Inspector
Note that the design of Method Inspectors has changed somewhat since the demo video.
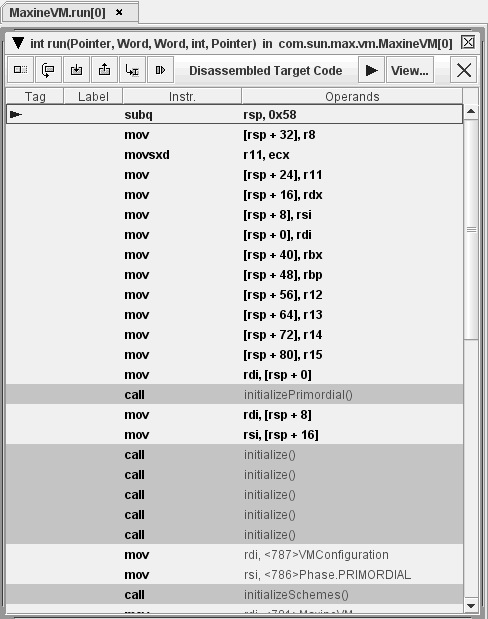
Method Inspector with machine code
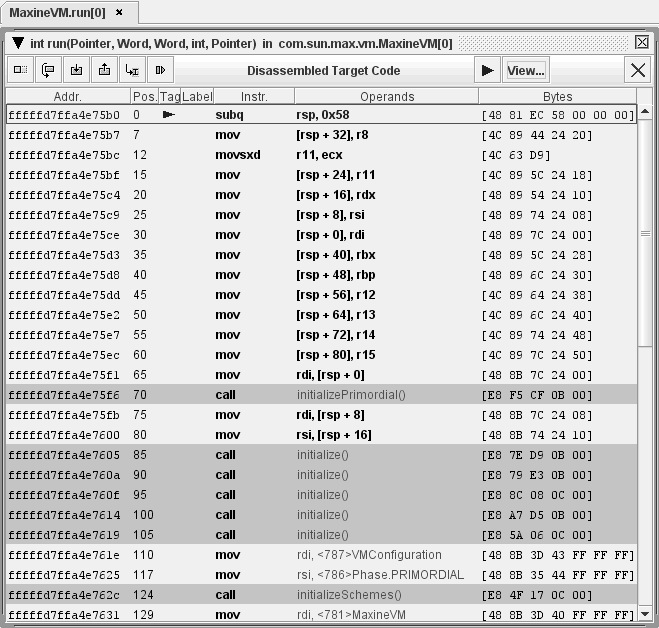
The first example shows a Method Inspector displaying the disassembled
machine code for the Java method com.sun.max.vm.MaxineVM.run(), which
is called by the VM at the conclusion of the startup sequence.
Display features include:
- A tab that distinguishes the method inspector from others in a “tabbed window”;
- A window header that identifies the method in detail (which information is also available on the tab as a mouseover Tooltip);
- A suffix to the name that identifies the specific compilation of the method; in the example the suffix “0” identifies the machine code as the first entry in the method’s compilation history;
- A number of command buttons for Debugging;
- A dialog for setting view options, available from the View… button, in which specific display columns can be selected or deselected (the next example shows all columns);
- A Tag column that displays markers related to Debugging, such as the triangular symbol for the current Instruction Pointer in the first row of the example;
- A Label column that displays symbolic labels generated by the disassembler; information about the actual location in memory is available as a mouseover Tooltip in this column, and a menu of commands related memory locations is available via mouse right-click over this column;
- An Instruction column displaying mnemonic machine operations, as configured for the target instruction set; and
- An Operands column displaying mnemonics for machine code operands, as configured for the platform instruction set; in the special case where memory addresses appear in machine code operands, the inspector empirically determines whether the address points at a heap object or code entry, and if so, displays that information symbolically; additional display and interactive options are available over such references, as described in the Field Values section in Heap Objects.
Optional display columns
The second example window shows the same method inspection as the first, but with all possible columns selected for view. The addtional columns include:
- An Address column displaying absolute memory location of the code, which information is also available via mouseover Tooltip on the Label column;
- A Position column displaying memory location as a byte position relative to the beginning of the method, which information is also available via mouseover Tooltip on the Label column; and
- A Bytes column that displays each instruction in raw bytes.
Bytecode
A Maxine Method Inspector displays the code in a method body in several ways. Here we show how Java bytecode can be disassembled and displayed with useful interactive behavior.
View a short demo here, or see below for a discussion and screen snapshots of the Bytecode Inspector.
Note that the design of Method Inspectors has changed somewhat since the demo video.
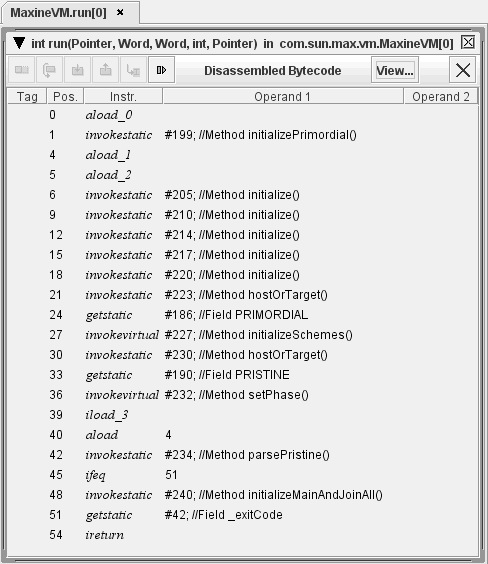
Method Inspector with bytecode
The first example shows how the Method Inspector displays disassembled
bytecodes for the Java method com.sun.max.vm.MaxineVM.run(), which is
called by the VM at the conclusion of the startup sequence.
Display features include:
- A tab that distinguishes the method inspector from others in a “tabbed window”;
- A window header that identifies the method in detail (which information is also available on the tab as a mouseover Tooltip);
- A number of command buttons for debugging;
- A dialog for setting view options, available from the View… button, in which specific display columns can be selected or deselected (the next example shows all columns);
- A Tag column that displays markers related to debugging, such as instruction pointer, call return site, and breakpoint;
- A Position column that displays the byte offset at the beginning of each instruction, relative to the beginning of the code block;
- An Instruction column displaying the mnemonic name of each bytecode instruction, as defined by the specification for the Java Virtual Machine; and
- Two Operand columns displaying bytecode operands in a format based loosely on the examples in the book The Java Virtual Machine Specification and on the output of the command line disassembler javap; bytecode operands identifying constant pool entries that reference Java language objects are displayed symbolically, and the displays have useful display and interactive behavior; for example, a mouseover Tooltip displays the full Java description for the reference and identifies whether the reference has been resolved.
Optional display columns
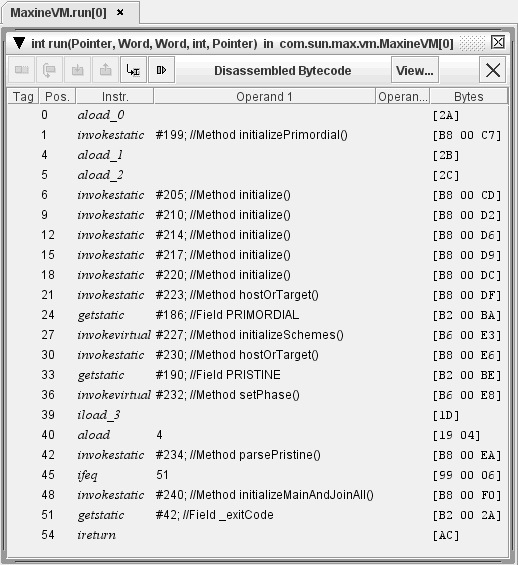
The second example window shows the same method inspection as above, but with an additional column selected for view:
- A Bytes column displays each instruction in raw bytes.
Multi-code Method Views
A Maxine Method Inspector displays the code in a method body in several ways, and can do so in more than one way simultaneously. Here we show how machine code and bytecode for a method body can be viewed together.
View a short demo here, or see below for a discussion of the combined method views.
Note that the design of Method Inspectors has changed somewhat since the demo video.
Method Inspector with machine code and bytecode
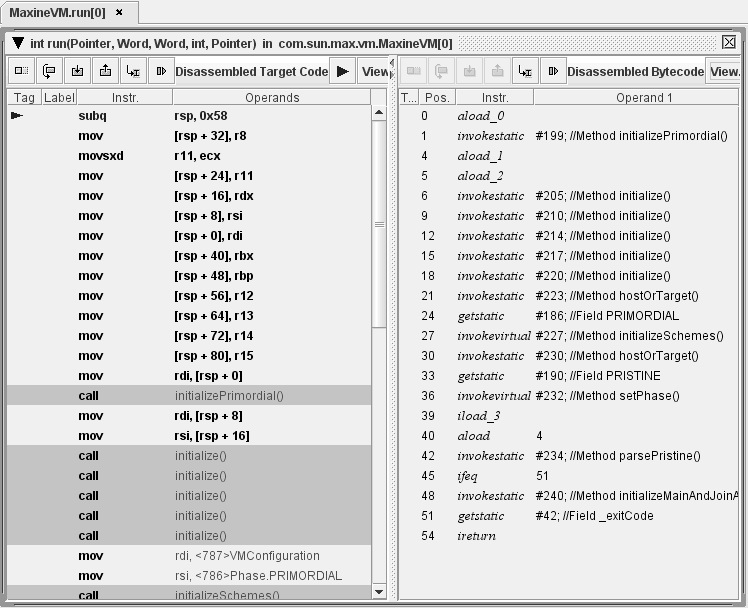
The example below shows the same method used in previous examples: Java
method com.sun.max.vm.MaxineVM.run(), which is called by the VM at the
conclusion of the startup sequence.
In this view, both machine code and bytecode have been enabled, managed
via the menu available on the triangle at the upper left corner of the
Method Inspector.
It is possible to debug in a multi-code method view. When a reliable map between machine code and bytecode locations is available (currently true only for the Maxine VM’s template-based JIT compilations), the Instruction Pointer location will be visible in both views and will track correctly during single stepping. Breakpoints can be set in either code view, although the detailed behavior of the breakpoints may differ in some situations.
[STRIKEOUT:A third option, to display source code, will be added.]
Threads
The Threads Inspector is one of the Maxine Inspector’s tools for examining machine state during execution of the Maxine VM. It also serves to change the focus of other, thread-specific views in the Inspector: Thread Locals, Registers, and Stacks.
View a short demo here, or see below for a discussion and screen snapshot of the Threads Inspector.
Note that the design of the Thread Inspector has changed somewhat since the demo video.
The Threads Inspector
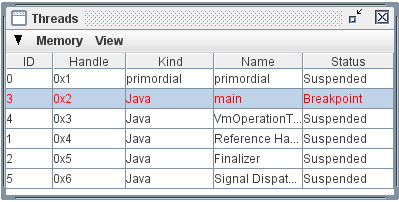
The Threads Inspector displays a table of basic information about each thread that exists in the VM process, including by default the following columns:
- ID: a numeric identifier associated with the native thread in the underlying OS.
- Handle: a numeric identifier associated with Java threads managed by the Maxine VM.
- Kind: a string identifying the kind of thread, for example “Java” for threads created and managed by the VM, “primordial” for the the special native thread used to bootstrap the VM, and no name for other native threads.
- Name: a human-readable string assigned by the VM to describe the role of the thread, for example those showing in the window include the main Java thread, Java utility threads for reference management and finalization, and the special native thread used to bootstrap the VM which we call the “primordial” thread.
- Status: describes what is known about the state of the thread, for example “Suspended” or at “Breakpoint”.
Aside: There is no thread in a Maxine VM that either runs or supports the Maxine Inspector, a crucially important design decision for enabling the debugging of low level VM mechanisms. The Inspector runs in a separate process and communicates with the VM process in an OS-specific fashion, for example via “libproc” in Solaris.
The current thread selection
A mouse left-click on one of the rows causes the displayed thread to become the “current thread selection” shared by all tools in the Inspector (see User Focus). Several Inspector views display thread-specific information, based on the current thread selection: the Thread Locals Inspector, the Registers Inspector, and the Stack Inspector. Furthermore, most memory-based views contain a Tag column in which each row may contain the name of any registers for the currently selected thread that point into the memory designated by the row.
Thread Locals
The Maxine VM allocates an internal Memory Region for each Thread that is used to store implementation data that is private (or “local”) to the threads implementation. This storage is not to be confused with thread-local storage provided as part of the Java programming model.
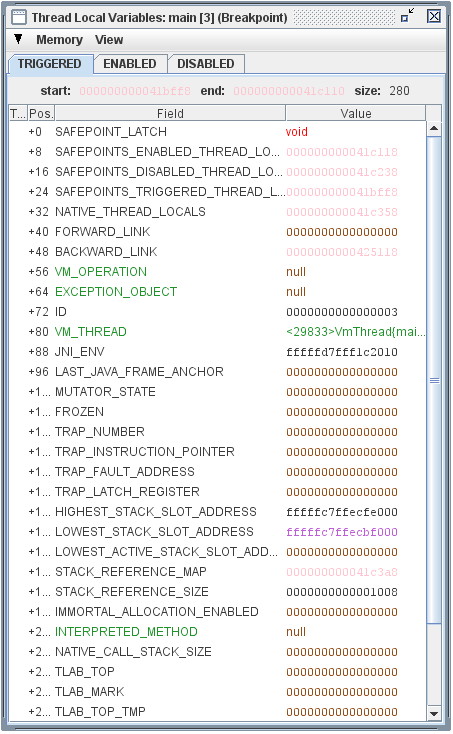
The VM’s Thread Local Variables for the currently selected thread (see Threads) are displayed by the Thread Locals Inspector, as shown in the example to the right. These variables are part of each thread’s internal implementation, in the form of word-length name-value pairs described by default with the following columns:
- Tag: as with other memory-related views, the Tag column displays the names of any registers for the currently selected thread that currently point at the row’s memory location, as well as the possible presence of a Watchpoint. A mouse double-left-click in the Tag column sets a watchpoint at the specified location.
- Pos.: the offset of the local variable slot from the beginning of the variable set, specified in bytes.
- Field: the name by which the VM’s internal implementation knows the particular thread-local variable. A mouseover Tooltip displays a documentation string, specified in the VM’s implementation, that describes the role of the variable in human-readable form.
- Value: the current contents of each word using techniques described elsewhere (see Memory Word Values).
The selection of visible columns can be selected using a dialog created by the View Options entry in the Inspectors View menu. Additional columns available include Address and the standard Memory Region Column.
Note that the Maxine VM implementation maintains three copies of the
thread locals, identified by the three tabs that select which one to
view: TRIGGERED, ENABLED, or DISABLED.
Registers
The Registers Inspector is one of the Maxine Inspector’s tools for examining machine state during execution of the Maxine VM.
View a short demo here, or see below for a discussion and screen snapshot of the Registers Inspector.
Note that the design of the Registers Inspector has changed since the demo video. Most significantly, is no longer possible to set the current thread selection from the Registers Inspector; the tabs at the top of the view have been removed. Thread selection is now done only from the Threads Inspector.
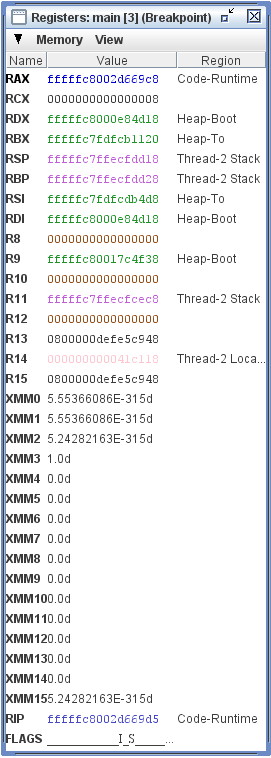
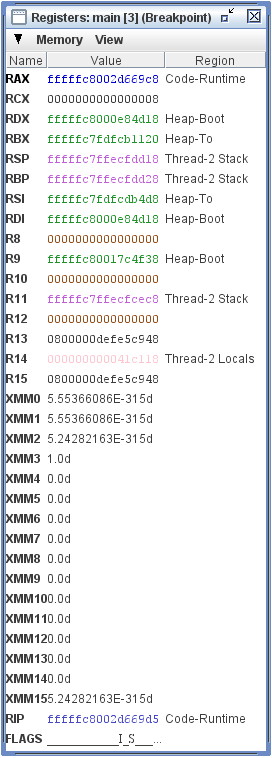
The Registers Inspector displays the register contents in the VM for the thread that is currently selected in the Threads Inspector. The name, ID, and state of this thread appear in the title bar of the Registers Inspector window.
The Registers Inspector displays a list of name/value tuples, described by the following columns that appear in the example to the right:
- Name: a string identifying the register, derived from an architectural description of the target machine for which the VM was built.
- Value: the current contents of the registers, refreshed by reading from the VM process each time the VM halts. Number-valued register values are displayed with numerous visual and interactive behaviors that depend on the value, as described elsewhere (see Memory Word Values).
- Region: the standard, optional Memory Region Column, which identified the known memory region, if any, into which the current register value points.
When a register changes value after a VM execution (either by single step or by running to a breakpoint), attention is drawn to that register in this Inspector by coloring the Name in red. With each successive execution of the VM, as the value ages, the register name migrates from red, though magenta, then blue, and finally black.
A mouse middle-button click over one of the values in XMM registers cycles the Value display through three modes: hexadecimal, single-precision float, and double-precision float; (see Memory Word Values). Since the VM only uses the lower 64 bits of XMM registers, the inspector display only this part.
The selection of visible columns can be made using a dialog created by the View Options entry in the Inspectors View menu. Additional columns available include Address and the standard Memory Region Column.
Stacks
The Stack Inspector is one of the Maxine Inspector’s tools for examining machine state during execution of the Maxine VM.
View a short demo here, or see below for a discussion and screen snapshot of the Stack Inspector.
Note that the design of the Stack Inspector has changed since the demo video. Most significantly, it is no longer possible to set the current thread selection from the Stack Inspector; the tabs at the top of the view have been removed. Thread selection is now done only from the Threads Inspector.
The Stack Inspector displays the stack and currently selected stack frame in the VM for the thread that is currently selected in the Threads Inspector. The name and status of this thread appears in the title bar of the Stack Inspector window.
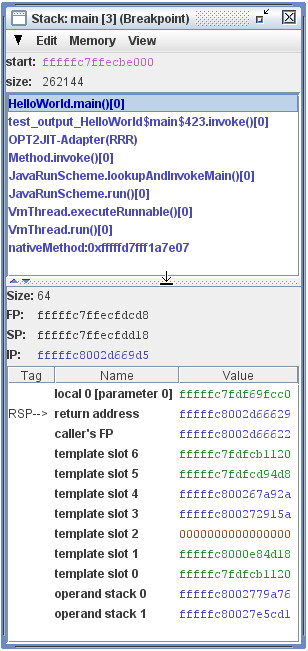
Each Stack Inspector displays several kinds of information:
- The Memory location of the stack is expressed at the top of the
display as a start memory address, expressed in hexadecimal, and
sizein bytes in the VM. - The middle of the display lists the stack frames currently on the
stack, identified by unqualified method name and compilation
sequence identifier.
The currently active method appears at the top; native code about
which nothing is known is identified by memory address of the
entry.
The stack can have a single selected frame,
HelloWorld.main()0in the example, selected with a mouse left-click over the list entry. - The bottom pane of the display describes the currently selected stack frame, including a list of slots contained in the frame.
Selecting a stack frame causes it to become the currently selected stack frame (see User Focus). It has the side effect of creating a Method Inspector for the method with a Machine Code view, a Bytecode view, or both, depending on user preferences and availability of the two representations.
The currently selected stack frame
The contents of the currently selected stack frame appear at the bottom
of the view, beginning with specific information concerning the size of
the frame and certain key pointers: FP, SP, and IP.
Below those appears a list of the stack slots in the frame, described by
default using three columns:
- Tag: as with Tag columns in other Inspectors, lists any registers in the currently selected thread that point at this location, along with a possibly set Watchpoint. A mouse double-left-click in the Tag column sets a watchpoint at the specified location.
- Name: a symbolic name of the slot, derived from internal descriptions of the frame layout.
- Value: the current value in the memory location, refreshed from VM memory after each execution; displayed with numerous visual and interactive behaviors that depend on the value, as described elsewhere (see Memory Word Values).
The selection of visible columns can be made using a dialog created by the View Options entry in the Inspectors View menu. Additional columns available include Address, Offset, and the standard Memory Region Column.
Breakpoints
Debugging with the Maxine Inspector is facilitated by a polymorphic approach to code breakpoints that is still very much under development. Just as code can be viewed in more than one way (Machine Code, Bytecode, and eventually source code - see Multi-code Method Views, debugging will likewise be carried out in terms of more than one level of code view.
View a short 2008 demo here, or see below for a discussion and screen snapshot of the Breakpoints Inspector.
Note that the design of the Breakpoints Inspector has changed somewhat since the demo video.
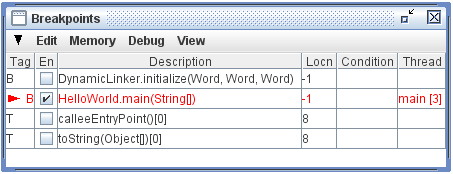
The Breakpoints Inspector lists all breakpoints that exist in the current session and displays their status, by default with the following columns:
- Tag: specifies whether the breakpoint is expressed in terms of a machine code (method compilation) location in memory (“T”) or as a bytecode location (“B”). The implementation of bytecode breakpoints is incomplete at this time, and source code breakpoints are not yet supported. The column also displays a pointer at the breakpoints, if any, that currently have blocked a thread.
- En: a checkbox that can be used to enable/disable a specific breakpoint.
- Description: identifies the Java method in which the breakpoint is set, and a mouseover Tooltip provides more detailed information.
- Locn: describes the position in the method code at which the breakpoint is set, expressed in bytes from the method entry. A value of -1 denotes abstractly the entry of a method, even if little about the method is known.
- Condition: an editable field in which an expression can be supplied that makes the breakpoint conditional, supported at present only for machine code breakpoints
- Thread: identifies a thread, if any, that is currently stopped at the breakpoint.
A mouse left-click over a row in the Breakpoints Inspector causes it to become the currently selected breakpoint (see User Focus). It has the side effect of making the breakpoint’s code location visible in a Method Inspector showing the appropriate kind of code (machine code or bytecode); it also selects the instruction at that location. A special colored box appears in the Tag column of a code view at the location of a breakpoint.
Setting breakpoints
The Maxine Inspector provides a number of ways to set and clear (delete) breakpoints:
- commands on the standard Debug menu;
- commands in the Edit menu on the Breakpoints Inspector’s menu bar;
- debugging command buttons on Method Inspector code views (for example mouse left-double-click over a code instruction; and
- by keyboard shortcuts.
The semantics of machine code and bytecode breakpoints differ, most notably because there can be 0, 1, or many compilations of a single method. A machine code breakpoint is anchored at a specific memory location in the code region, and is thus in effect for only that specific compilation, whereas a bytecode breakpoint should in principle be in effect for every compilation of the method, current and future.
Breakpoints persist across sessions as long as the same boot image is being used; that restriction may be eliminated in the future for some kinds of breakpoints.
Watchpoints
Debugging with the Maxine Inspector is facilitated by a watchpoint mechanism, supported on some platforms, that is currently under development. It is possible to place watchpoints that catch reads and/or writes and/or executions taking places at specified memory locations.
Because debugging in the presence of relocating Garbage Collection is especially problematic, the Inspector’s watchpoint mechanism supports specific features above and beyond conventional watchpoint behavior:
- a watchpoint may be specified either in terms of an absolute memory location (the conventional mode) or in terms of a specific object and its fields. The latter are known as Maxine object watchpoints, and they will be automatically relocated by the Inspector when the object’s representation in VM memory is relocated by GC.
- a watchpoint may be configured to be either active or inactive during execution periods when GC is underway; this can help suppress spurious watchpoint triggers caused as a side effect of ordinary rearrangement of memory by GC.
The Watchpoints Inspector lists all watchpoints that exist in the current session and displays their status, as shown in the following example.
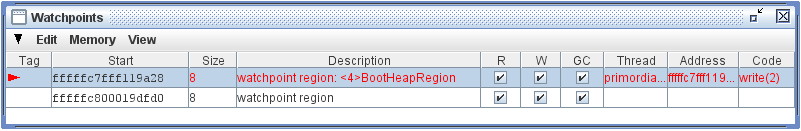
The columns visible in this example include:
- Tag: displays a red pointer at the watchpoint, if any, that has blocked a thread.
- Start: the VM memory address at which the watchpoint starts.
- Size: the amount of memory in bytes covered by the watchpoint.
- Description: a string describing how the watchpoint was created:
- “watchpoint region” if set only at a specified memory location, or
- containing a description of an object if set on one or more fields of an object; in this case the location of the watchpoint will be updated automatically whenever the representation of the object is moved in VM memory by GC.
- R: a checkbox controlling whether the watchpoint should trigger when the memory location is read.
- W: a checkbox controlling whether the watchpoint should trigger when the memory location is written.
- GC: a checkbox controlling whether the watchpoint should trigger at all during VM execution periods when GC is operating.
- Thread: the thread, if any, that triggered the watchpoint.
- Address: the specific location, if any, that triggered the watchpoint.
- Code: an indication of what action in the VM caused the trigger.
Optional display columns
Additional columns may be displayed via a dialog produced by the View Options entry in the Inspector’s View menu. They include:
- X: a checkbox controlling whether the watchpoint should trigger when the memory is read for execution, false by default.
- the standard Memory Region Column.
Setting watchpoints
Watchpoints may be created and managed in several ways:
- using entries in the Edit menu on the Inspectors menu bar.
- by mouse left-double-click over the Tag column in any view for which rows correspond to memory ranges.
- using a menu produced by mouse right-click over the Tag column in any view for which rows correspond to memory regions.
Debugging
The Maxine Inspector supports a number of debugging features, most of which leverage the views that have been described in other segments. This section describes how to use those features to handle some specific situations. More features for debugging and more discussion of this topic are forthcoming.
Debugging Traps
To find out when a hardware trap happens, you can set a machine code
breakpoint in the responsible trap handler.
For example, when you are interested in SEGV signals, set a Breakpoint
in com.sun.max.vm.runtime.Trap.handleSegmentationFault(), using the
menu item Debug → Break at Method Entry → Compiled Method... or its
keyboard shortcut CTRL-SHIFT-E.
Once the VM is stopped at the breakpoint, remove it and place
breakpoints at every exit from the method (RET instruction on x64).
Then resume the process.
Once one of the latter breakpoints hits, the VM now has left information
about the trap in thread local storage where the inspector can pick it
up.
Select View → Stack from the menu.
This brings up a Stack inspector that shows the stack how it
was when the trap happened.
You can even find out which instruction was responsible by clicking on
the top frame.
The instruction will be highlighted by a blue selection border.
Note that the Registers Inspector will not show register values from the trap site, but the current register values in the trap handler.
Since some exceptions (e.g. null pointer, divide by zero) are implemented as implicit exceptions that are handled via traps, not every trap is necessarily a VM crash, but it may also be normal operation.
To observe divide-by-zero traps, use a different trap handler, then apply the same procedure as above.
Debugging through a Garbage Collection
If you set a breakpoint inside the GC implementation and suspend the VM there, you may find that some object references are no longer functioning. The Inspector detects when a GC is underway and then distinguishes references into the boot image from those into the runtime heap. Whereas the former are immutable and always intact, the latter are considered broken during GC. Where ever they appear in fields, array elements etc. they change in color from green to red and most interaction with them is disabled.
Once the GC has finished, the Inspector refreshes all the red references and they become green and fully functional again.
Native Code
The Inspector provides some limited support for debugging native code
that is either included in the VM image or loaded dynamically by user
code, e.g., with System.loadLibrary.
The Code menu provides an entry View native function by name.
This initially brings up a dialog with a list of loaded libraries, for
example, libjvm which contains the native code that supports the VM.
Selecting a library then brings up a list of functions defined in the
library.
Selecting a function then brings up a code view for that function.
These dialogs behave similarly to those for Java methods so that name
filtering, for example, works as expected.
Note that if this menu entry is invoked before a symbol lookup in the
library has occurred, the addresses of the functions in a library will
not be known.
In this case a dialog with the text “Functions are not available at this
stage” is displayed.
This window is usually very short and is unlikely to be encountered in
practice.
A breakpoint may be set at the entry to a native function by the Debug -> Break at machine code -> Native function, which brings up similar
dialogs.
There is currently no support for symbolic display of instructions within a native function, and stack walking is not implemented within a chain of nested function calls.
Notepad
The Inspector provides a persistent notepad for the user’s convenience. The notepad contains an arbitrary collection of text that the user can manage and which endures across restarts of the Inspector. A small amount of specialized behavior driven by the contents of the notepad is supported, and this may be extended in the future.
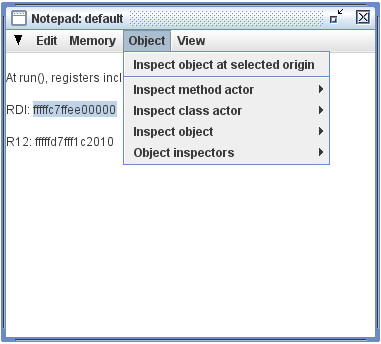
Viewing and editing access to the Inspector’s notepad is provided by the Notepad Inspector, an example of which appears to the right. This Inspector is a very simple text editor whose single buffer is implicitly persistent; it need not be explicitly saved, and it will always endure across Inspector sessions.
Text in the Editing commands include the familiar Cut/Copy/Paste commands, which interoperate with the same system clipboard used by the rest of the Inspector and which are available in three ways:
- from entries on the Inspector’s Edit menu;
- from entries on a menu that pops up in response to a mouse right-click over the editing area; and
- from conventional keystroke accelerators, which are noted in the menu entries.
Specialized behavior
Additional specialized behavior is available when a selected range of text can be interpreted as a memory address expressed in hexadecimal, as is the selection in the example:
- the commands Inspect memory at selected address and Inspect memory region containing selected address become enabled and can create Memory Inspectors as suggested by their names. These commands appear on a menu that pops up in response to a mouse right-click over the editing area and as context-specific additions to the standard Memory menu on the menu bar. When the selection cannot be interpreted as a memory address, the commands are disabled and grayed out.
- when the selected range of text can be interpreted as a memory address that is the origin of a VM Heap Object, the command Inspect object at selected origin becomes enabled and can create an Object Inspector displaying the object’s representation. This command appears on a menu that pops up in response to a mouse right-click over the editing area and as a context-specific addition to the standard Object menu on the menu bar (see example). When the selection cannot be interpreted as a memory address that points at an object origin, the command is disabled and grayed out.
User Focus
The views (known as individual “Inspectors”) available within the Maxine Inspector make visible many different aspects of the VM state (see, for example, the Inspectors listed on the standard View menu), and many of them support some kind of user-driven selection. Some selections have side effects that cause other Inspector views make visible information related to the selection; in other words, some view actions are coordinated by user selections. The mechanism for this coordination is the user focus. When the description of an Inspector refers to the currently selected X, for some kind of VM entity X, it refers to the specific instance of X that is set in the user focus.
Some user selections have the side effect of setting a user focus: a selection that is shared among all Inspector views. At present, such shared selections include:
- Thread
- Stack Frame
- Code Location (Machine Code, Bytecode, or both)
- Breakpoint
- Watchpoint
- Memory address
- Heap Object
Strict View Coordination
In the case of threads, the coordination among views is strict, so that there is an invariant relationship among certain thread-specific views:
- The Registers Inspector only displays the registers for the currently selected thread.
- The Stack Inspector only displays the stack and its stack frames for the currently selected thread.
- The Thread Locals Inspector only displays thread local storage for the currently selected thread.
- Machine Code Inspectors and Bytecode Inspectors display the instruction pointer and call return sites on the stack only for the currently selected thread.
- Any Tag column in a memory-related view adds annotations only for registers in the currently selected thread that point into the row’s memory region.
Another example of strict coordination occurs within the Stack Inspector. The lower part of the Inspector only displays the stack frame slots for the currently selected stack frame.
Relaxed View Coordination
Some selections that set the user focus have side effects on other views, but there is no strong invariant of the sort mentioned above for threads. The goal of these side effects is to bring into user view some relevant information about the entity just selected. The specific nature of these rules is evolving, based on user experience. Examples include:
- Selecting a frame in the Stack Inspector causes the instruction pointer in the frame (if the top frame) or call return pointer (if other than the top frame) to become the currently selected code location. This in turn causes the appropriate Method Inspector to display the method and select the code location in that view.
- Selecting a breakpoint causes its location to become the currently selected code location, which in turn causes the appropriate Method Inspector to display the method and select the code location in that view.
Subsequent actions, for example selecting another code instruction, will break these relationships.
The User Focus Inspector
A specialized inspector displays the current members of the user focus at any time. In the example below, every aspect of the user focus is non-null, but this is not always the case.
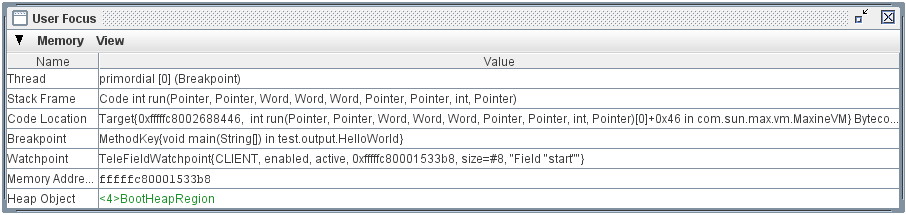
This Inspector is intended mainly for testing the Maxine Inspector itself (which is why it appears only in the Test menu on the main menu bar), but it can be useful to help understand unexpected interactions.
Menus
The Maxine Inspector displays menus in three contexts:
- the main menu bar, which appears at the top of the entire application frame;
- an inspector menu bar on each of the specific Inspector views; and
- a popup menu that appears in response to a mouse right-click.
A distinguished set of standard menus can appear in many contexts and have behavior that is generally independent of context. In other words these menus have the same names, entries, and behavior no matter where they appear. The standard menus, described in more detail below, are named Memory, Object, Code, Debug, and View.
Other menus have behavior that is generally dependent on context, for example the Default menu that is accessible at the upper left of every Inspector view under a triangle icon, and the Edit menu that appears on Inspectors where the displayed contents can be modified in some way.
Finally, some menus are a combination of a standard menu with additional context-dependent entries added before the standard entries, separated by a horizontal separator.
The Main Menu Bar
The standard menus Memory, Object, Code, Debug, and View appear, among others, in the main menu bar of the Inspector, as shown below:
Other menus, unique to the main menu bar include:
- Inspector: general functionality, including Refresh all Views, Close all views, Preferences, and Quit Inspector.
- Java: very specialized commands concerning the VM, for example setting tracing level in the VM.
- Test: some commands specialized for debugging the Inspector. Most list some summary of internal state to the console. The exception, View User Focus, creates the User Focus Inspector, which summarizes all the aspects of current user focus, for example selected selected thread, stack frame, selected memory address, etc. See User Focus.
- Helep: access to the Inspector’s Help System would be here, if it had one. Sorry.
The Standard Memory Menu
The standard Memory menu contains entries designed to create and manage Inspectors related to low-level memory properties of the VM. They include:
- Inspect memory region: produces a dynamically generated submenu listing all known Memory Regions. Selecting an entry produces a Memory Inspector whose display spans the region.
- Inspect memory at address…: produces a dialog in which a memory address can be entered, which in turn produces a Memory Inspector whose display begins at the specified address.
- Inspect memory bytes at address…: produces a dialog in which a memory address can be entered, which in turn produces a Memory Bytes Inspector whose display begins at the specified address.
- Memory inspectors: produces a dynamically generated submenu listing all existing Memory Inspectors. Selecting an entry brings the Inspector window to the foreground.
- View Memory Regions: produces the Memory Regions Inspector. This entry also appears on the standard View menu.
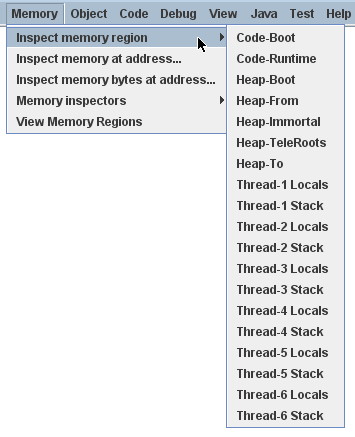
As with all standard menus, the standard Memory menu also appears on some individual Inspector windows. When it does appear, it often contains some additional entries that are context-dependent, which is to say their behavior depends on the particular Inspector in which it appears. For example, each Object Inspector adds the entry Inspect this object’s memory, which produces a Memory Inspector whose display spans the representation of the object being inspected.
The Standard Object Menu
The standard Object menu contains entries designed to create and manage Object Inspectors. They include:
- Inspect method actor: produces a dialog that permits identification (by name) of a Java method presumed to be loaded into the VM. If so, this produces an Object Inspector on the special VM object (of type MethodActor) that the VM uses to represent information about the method.
- e: produces a dialog that permits identification (by name or ID) of a Java class presumed to be loaded into the VM. If so, this produces an Object Inspector on the special VM object (of type ClassActor) that the VM uses to represent information about the class.
- Inspect object: produces a dialog that permits identification of a Java object (by address or Inspector session ID) presumed to exist into the VM. If so, this produces an Object Inspector on the object.
- Object Inspectors: produces a dynamically generated submenu listing all existing Object Inspectors. Selecting an entry brings the Inspector window to the foreground.
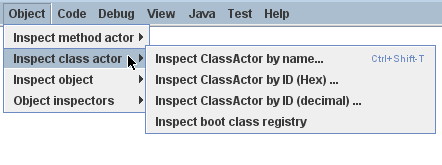
As with all standard menus, the standard Object menu also appears on some individual Inspector windows. When it does appear, it often contains some additional entries that are context-dependent, which is to say their behavior depends on the particular Inspector in which it appears. For example, each Method Inspector adds entries that create Object Inspectors for VM objects that represent important information about the method being viewed: class, method, compilation, etc.
The Standard Code Menu
The standard Code menu offers a number of ways to locate and view code in the VM:
- at current selection: the currently selected code location (see User Focus), if set.
- at current IP: at the code location of the instruction pointer in the currently selected thread.
- target code…: a method selected interactively from all known compiled methods, first by class and then by method. Typing into a filter field in these dialogs makes them a very fast way to find an existing compilation.
- method code by name: a method described interactively by specifying a name.
- boot image method codew:
- target code address: compiled code located at a memory address entered interactively into a dialog.
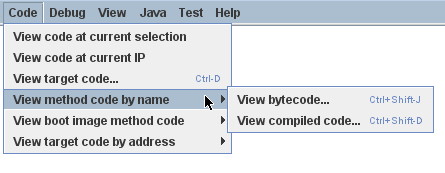
The Standard Debug Menu
The standard Debug menu is unusual in that contains two categories of entries (both related to debugging), separated by a horizontal line.
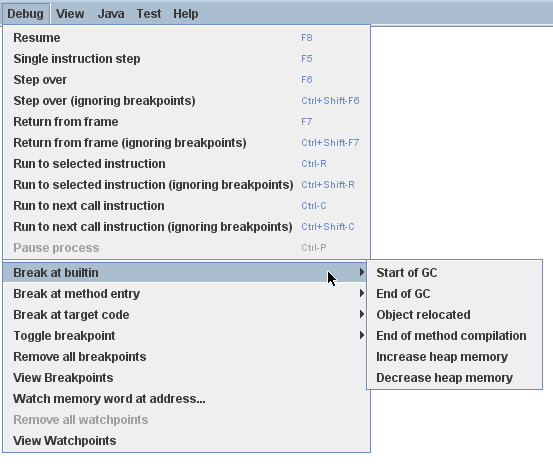
The first category of menu entries provide debugging control of the VM process: Resume, Step (sometimes known as “step in”), Step over, Return (sometimes known as “step out”), Run to selected…, Run to next call…, Pause, and variations.
The second category offers management of breakpoints and watchpoints in the VM’s process.
- Break at builtin: produces a submenu containing predefined locations in the VM at which breakpoints can be set; this is a convenience for setting breakpoints at significant VM events, without requiring that the user know in advance exactly what method represents the action.
- Break at method entry: produces one of a variety of dialogs for specifying methods at which an entry breakpoint should be set.
- Break at target code: produces one of a variety of dialogs for specifying locations in memory at which a machine code breakpoint should be set.
- Toggle breakpoint: turns on or off the breakpoint at the currently selected code location (see User Focus).
- Remove all breakpoints: (enabled only when there are breakpoints set) clears all breakpoints from the VM process.
- View Breakpoints: creates the Breakpoints Inspector.
- Watch memory word at address: produces a dialog in which the use can enter a specific memory address in hexadecimal, which will be used as the origin of a newly created Object Inspector.
- Remove all watchpoints: (enabled only when there are watchpoints set) clears all watchpoints from the VM process.
- View Watchpoints: creates the Watchpoints Inspector.
The Standard View Menu
The standard View menu provides access to all the different kinds of Inspectors that are available during a Maxine inspection session. Most are singletons, in which case the specified Inspector is either created or simply brought to the front if it already exists. In the two cases where there can be any number of inspectors (Memory and Objects), submenus are dynamically generated that allow a specific inspector to be brought to the front.
- Boot image info: produces the Boot Image Inspector
- Breakpoints: produces the Breakpoints Inspector
- Memory inspectors: produces a dynamically generated submenu listing all existing Memory Inspectors. Selecting an entry brings the Inspector window to the foreground.
- Memory regions: produces the Memory Regions Inspector
- Method code: produces the Method Inspector.
- Notepad: produces the Notepad Inspector
- Object Inspectors: produces a dynamically generated submenu listing all existing Object Inspectors. Selecting an entry brings the Inspector window to the foreground.
- Registers: produces the Registers Inspector
- Stack: produces the Stacks Inspector
- Threads: produces the Threads Inspector
- VM thread locals: produces the VM Thread Locals Inspector
- Watchpoints: produces the Watchpoints Inspector
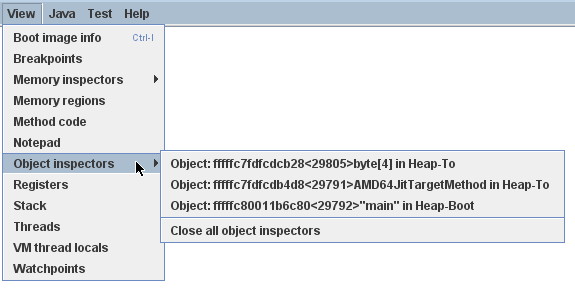
As with all standard menus, the standard View menu also appears on individual Inspector windows. When it does appear, it contains some additional entries that are context-dependent, which is to say their behavior depends on the particular Inspector in which it appears. The two that are present in most cases are:
- View options: produces a dialog that permits setting persistent User Preferences related to the views. In cases where multiple Inspectors of a given kind can exist, the dialog permits setting each preference either temporarily (just for the instance being viewed) or persistently for all subsequently created Inspectors. These include inspectors for Memory, Methods, and Objects.
- Refresh: causes data being displayed in this specific view to be reread from the VM and re-displayed.
The Default (“Triangle”) Inspector Menu
Every Inspector Window contains a “Default” menu with generic command that relate mostly to windows, for example Close, Close Other Inspectors, Refresh, and sometimes Print.
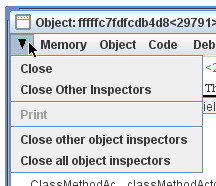
Some default menus contain additional entries with more specific, context-dependent behavior. For example, the default menu in the Object Inspector example to the right contains the two commands Close other object inspectors and Close all object inspectors, and the default menu in every Memory Inspector contains analogous entries.
User Preferences
Most of the Inspector’s views provide user selectable view options that configure the information appearing in the displays. In some cases these preferences can be set for either a specific instance (for example a particular Object Inspector, or as a general preference for all subsequently created views of that kind.
The view options relevant to each Inspector are by convention available via a menu item named View Options on the window frame of the particular Inspector. A summary of all view options, as well as other user preferences, can be managed invoking the Preferences action on the Inspector’s main menu bar. The image below displays the current appearances of the dialog for managing user preferences.
The settings of these preferences are made persistent by default, stored in a file typically named maxine.ins.
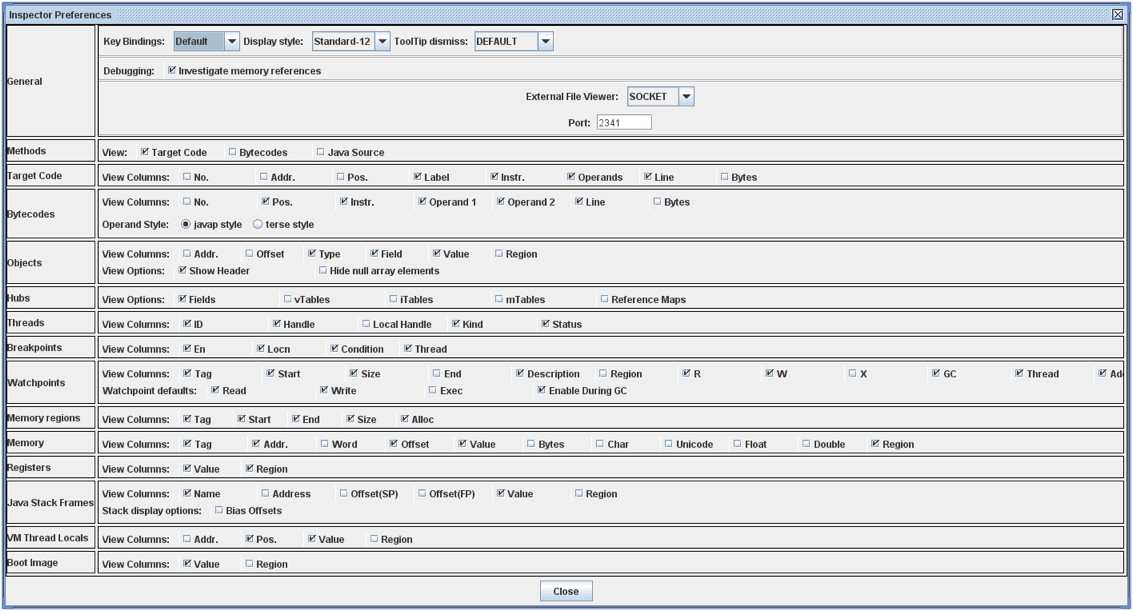
How the Inspector interacts with the Maxine VM
This page describes how the Maxine Inspector’s interaction with a running VM is implemented.
General goals for the Inspector all deal with making development and experimentation in the Maxine VM as productive and widely accessible as possible:
- Support basic debugging of the Maxine VM, something not possible with standard tools.
- Make visible as much internal VM state as possible, both in terms of design abstractions and in terms of low-level representations, even when the VM is broken.
- Provide new developers with a fast path to understanding VM internals.
A few general strategies guide the Inspector’s implementation:
- Run in a separate process (usually local, but see Guest VM), so that inspection depends neither on a correctly running VM process nor there being any process that all.
- Require as little active support from the VM as possible, in particular require no active agent.
- Reuse as much VM code as possible, especially reading/writing/understanding the low-level representations of data on the target platform (possibly different than the platform on which the Inspector runs).
- Load VM classes into the Inspector for reflective use in understanding VM data.
- Rely on platform-specific implementations for low-level interaction with a running VM: process control, threads, breakpoints, access to memory and registers.
This section describes the Inspector’s access to the lowest level abstractions in the VM process, namely the resources provided by the underlying platform: memory, threads, and execution state.
One of the most difficult and frustrating parts of the Inspector’s implementation is the need to implement low-level process controls on the several supported platforms. These controls include reading and writing from the VM’s memory, finding and inspecting threads, setting breakpoints, setting watchpoints, and deciphering process state.
Generic controls are implemented in class
com.sun.max.tele.debug.TeleProcess.
Concrete subclasses using native methods implement the controls for
specific platforms:
- Solaris: platform support is best on Solaris, where libproc
provides a programmatic interface to the Solaris
/procpseudo-filesystem. Watchpoints are supported with no limit on their number (seeNative/tele/darwin/*.[ch]). - Linux: the Inspector uses a mixture of
ptrace(2)and/proc(seeNative/tele/linux/*.[ch]). - Mac OS X: on the Mac the Inspector uses a mixture of
ptrace(2)and the Mach API (seeNative/tele/darwin/*.[ch]). - Guest VM: the Guest VM variant of the VM runs in a Xen domain where such OS services are unavailable, so controls must be implemented using Xen inter-domain communication.
This code can be very subtle. It now seems to work fairly reliably, but at the cost of many hours deciphering non-documentation and gdb source code. In our experience, programming a debugger is a very niche activity.
Low-level memory access is implemented using basic process control
methods in class TeleProcess:
read(Address address, BtyeBuffer buffer, int offset, int length)
write(Address address, ByteBuffer buffer, int offset, int length)
However, interpreting the bits presents more of a challenge, since this
must be done for a VM running on a potentially different
platform.
Fortunately, the Inspector is able to load the Java classes that
describe the target platform and then reuse the VM’s own code for
reading and writing bits representing the VM’s internal primitive data
types.
Methods for reading and writing those types appears in interface
com.sun.max.tele.data.DataAccess, and all but the lowest-level read
methods are implemented by class
com.sun.max.tele.data.DataAccessAdapter.
For performance reasons, especially for non-local debugging such as with
the Guest VM, the Inspector caches pages of memory read since the most
recent process execution (see class
com.sun.max.tele.page.PageDataAccess).
The Inspector’s low-level interaction with the VM process can be
observed.
See Low-level logging for instructions
on enabling all low-level VM logging.
In order to observe only Inspector-related events, change log_TELE to 1
in Native/share/log.h, rather than log-ALL.
Although the Inspector is designed to rely as little as possible on the internals of the VM, there are a number of ways in which the VM is constructed to make inspection as easy as possible. The mechanisms described in this section incur zero runtime overhead in the VM, and involve no writing into VM memory.
The Inspector leverages considerable knowledge of the VM’s internal data representations to build its model of VM state, but it must have somewhere to start when beginning to read from a memory image. The boot image generator stores in the boot image header a number of addresses and other data that help the Inspector (and VM) find things. These addresses get relocated, along with the contents of the heap, during Bootstrap. The Inspector leverages detailed knowledge of the header’s contents in order to locate, among others:
- the VM’s schemes bindings, which are loaded into the Inspector
- the boot heap
- the boot code region
- the class registry
- the list of dynamically allocated heap segments
- the list of thread local areas
- the entry location of key methods
The Inspector uses a variety of mechanisms to locate instance or class fields in the heap. During the Inspector’s starting sequence (when little is yet known about VM state), fields are typically located by relying on specific knowledge of a few key object types, possibly using Java reflection on the VM classes (which are all loaded into the Inspector). This kind of access is relatively unsafe, since it bypasses the type system in the running VM. There are more abstract ways to access fields, but they rely on the Inspector’s model of VM’s class registry, which must first be created using the low-level mechanisms.
The simplest way to exploit higher-level field access mechanisms is to
annotate (in VM code) fields of interest using @INSPECTED.
The main method in com.sun.max.tele.field.TeleFields reads VM sources,
generates field access methods, and writes them back into itself for use
by the Inspector.
These access method implementations hide all the indirections necessary
to read or write field data (taking into account the hardware platform,
the layout being used, the particular representation for the object, and
the class layout) and return values of the desired types.
The Inspector uses a variety of mechanisms to locate methods and their
compilations (either instance or class).
Specific methods can be called out for enhanced access by the Inspector
by annotating (in VM code) those methods using @INSPECTED.
The offline program TeleMethods reads VM sources, generates method
access methods, and writes them into class
com.sun.max.tele.method.TeleMethods.
These access method implementations hide all the indirection necessary
to locate the annotated methods and their meta-information.
VM methods annotated with @INSPECTED can be interpreted by the
Inspector (for example, see TeleMethodAccess.interpret()).
Interpretation takes place in the Inspector’s process, but in the
execution context of the VM: object references are boxed locations in VM
memory, reading/writing is redirected through VM data access, class ID
lookup is redirected to the Inspector’s model of the VM’s class
registry, and bytecodes are located using reflection on the VM’s code
loaded in the Inspector.
The Inspector’s interpreter runs very slowly.
It is used routinely by the Inspector in only a few situations, where VM
data structures to be navigated are too complex (e.g. a hash table) to
be navigated robustly using low-level techniques.
For example, see the Inspector method
TeleCodeCache.findCompiledCode(Address), which interprets remotely the
VM method Code.codePointerToTargetMethod(Address).
Although the interpreter is in principle capable of writing into VM memory, it is not used in any situations where this happens.
Active VM support for inspection is kept to an absolute minimum, but in most cases either incur very little VM overhead or are enabled only when the VM is being inspected. There are several flavors of support mechanisms:
- Distinguished fields, usually static, where the VM records information exclusively for the consumption by the inspector.
- Distinguished methods, usually static and usually empty, called by VM code exclusively as potential breakpoint locations for the inspector; this is a weak kind of event mechanism.
- Special VM memory locations into which the Inspector writes for consumption by specific VM mechanisms.
As a matter of organization, this kind of support is implemented mainly
by VM classes in the package com.sun.max.vm.tele, but it often imposes
some obligations on specific scheme implementations, for
example to store a value or call a method.
These obligations are increasingly specified and documented in scheme
definitions.
The remainder of this section describes a few areas of active VM support for inspection.
Many support mechanisms in the VM operate conditionally, depending on
the value of static method
com.sun.max.vm.tele.Inspectable.isVmInspected().
This predicate checks one of the bits in the static field
Inspectable.flags in VM memory, which can be set in one of two ways:
- When the VM is started by the Inspector, the Inspector sets that bit
in VM memory early in its startup sequence (see Inspector method
TeleVM.modifyInspectableFlags()). - When the VM is not started by the Inspector, but when it is anticipated that the Inspector might subsequently attach the VM process, a command line option to the VM makes it inspectable.
At present, the VM cannot be made inspectable unless this bit is set early during the VM startup sequence.
The Inspector tracks every class loaded in the VM, as represented by the
current contents of the VM’s ClassRegistry; the Inspector maintains
that information using the Inspector class TeleClassRegistry.
The Inspector initializes its TeleClassRegistry at VM startup,
effectively identifying the classes already loaded in the boot heap; it
does this by directly reading (using low-level operations that rely on
significant knowledge of the data structures involved) the contents of
the VM’s ClassRegistry in the boot heap. As noted earlier, this data
structure cannot be read using the more abstract, relatively more
type-safe techniques in the inspector because those techniques rely on
type information stored in the TeleClassRegistry.
This is one of many circularities in the Inspector that reflect the
underlying meta-circularity of the Maxine VM.
As the VM loads additional classes dynamically, and when inspection is enabled, the VM records them using the following static fields in VM memory:
package com.sun.max.vm.tele;

public final class InspectableClassInfo {
    ...
    @INSPECTED
    private static ClassActor[] classActors;

    @INSPECTED
    private static int classActorCount = 0;
    ...
}
The Inspector refreshes the TeleClassRegistry each time the VM process
halts: it checks the VM’s count against its cache and reads information
from VM memory about any newly loaded classes.
No provision is made for tracking classes that the VM unloads. In fact, the VM implements class unloading by garbage collection, and a regrettable consequence of this inspection mechanism is that it prevents class unloading. This is by far the most egregious interference visited upon the VM by the Inspector, and it might be corrected in the future.
Implementations of the Maxine VM’s
heap scheme
are obliged to make certain calls, as documented and supported by the
scheme’s static inner class com.sun.max.vm.heap.HeapScheme.Inspect.
All of these calls delegate to the VM class
com.sun.max.vm.tele.InspectableHeapInfo, which provides several kinds
of services when the VM is being inspected (described below): heap
allocations, object relocations, and events.
Allocated heap segments
An inspectable, static field in the VM class
com.sun.max.vm.tele.InspectableHeapInfo holds the list of memory
regions currently allocated as heap segments.
This list is read from VM memory by the Inspector each time the VM
process halts; any additional heap segment allocations to the
information are tracked in the inspector class TeleHeap.
This enables the inspector to make a quick first check about whether a
VM memory location could hold a valid heap object, and permits a
visualization of all memory allocations made by the VM.
Object locations
The Inspector tracks heap objects of interest: sometimes because the user is viewing them, but much more frequently because they represent vital information about the execution state of the VM. In the presence of relocating garbage collection that can take place at any time (with respect to the Inspector), there is no practical way for the Inspector to track object locations without some support from the VM.
When the VM is being inspected, it actively supports object tracking by
allocating in VM memory an additional root table: an array of addresses
that are treated by garbage collection implementations as roots to be
updated as needed when objects move.
Entries in this table are treated by the VM as weak references: both to
minimize disruption of VM operation and for the Inspector to discover
when objects have become garbage.
Access to the root table is provided via inspectable static fields in
the VM class com.sun.max.vm.tele.InspectableHeapInfo.
The Inspector checks the root table each time the VM halts.
It does so by reading two static fields in
com.sun.max.vm.tele.InspectableHeapInfo that are incremented by the
garbage collectors: one counts the number of collections initiated so
far and one counts the number of collections completed.
The Inspector compares those two counters with their previous values.
If a new collection has concluded since the last refresh, then the
entire contents of the VM’s root table are copied into the Inspector’s
cache, where they are available for the Inspector’s implementation of
remote object references.
When the Inspector creates a new object Reference, based on a specific
address in the VM’s heap, that value is added to an empty slot in the
Inspector’s root table cache and is written through to the corresponding
location in the VM’s root table.
The Inspector can also observe object relocation directly, if needed, by setting a breakpoint on the following method:
InspectableHeapInfo.inspectableObjectRelocated(Address oldCellLocation, Address newCellLocation){}
This empty method is called each time an object is relocated and it exists for just this purpose.
Heap events
The VM makes it convenient for the Inspector to halt the VM process at
certain interesting events.
It does so by creating special methods that are called at those times,
methods that do nothing in the VM, but which are convenient for the
Inspector to set breakpoints.
The VM class com.sun.max.vm.tele.InspectableHeapInfo contains the
following methods of this sort:
inspectableGCStarted()inspectableGCCompleted()inspectableObjectRelocated()inspectableIncreaseMemoryRequested()inspectableDecreaseMemoryRequested()
The Inspector’s breakpoint mechanism requires active support from the Maxine VM’s compilation scheme. As a machine-level debugger, the natural kind of breakpoint supported by the Inspector (and by the underlying platform) is specified in terms of a memory location in compiled machine code. However, the Inspector also supports breakpoints specified in terms of a method’s signature, so-called bytecode breakpoints. The Maxine VM runs only compiled code, so a bytecode breakpoint is understood to mean that there should be a corresponding machine code breakpoint set in every compilation of the method, present or future. A bytecode breakpoint can even be set (at location 0) for methods not yet loaded into the VM.
An early implementation of bytecode breakpoints divided responsibility for setting these breakpoints: the Inspector set them for existing compilations and a request was written into a queue in the VM for the runtime compiler, which would create the machine code breakpoints in any subsequent compilation. This approach had an irreconcilable race and was replaced by the simpler approach of halting the VM immediately after every method compilation. The Inspector would compare the compiled method against its current list and set a machine code breakpoint if needed. This implementation proved to incur too much overhead for non-local debugging, notably for Guest VM.
The current implementation (see Inspector class
TeleBytecodeBreakpoint) halts the VM after method compilations, but
filters those events.
Each time the Inspector’s list of bytecode breakpoints changes, the
Inspector writes into VM memory an easily parsed list of textual type
descriptors for those classes for which one or more bytecode breakpoints
are currently set.
Implementations of the VM’s
compilation scheme
are required to call a static notification method in the scheme’s static
inner class com.sun.max.vm.heap.HeapScheme.Inspect at the beginning
and end of each method compilation.
This delegates to VM class com.sun.max.vm.tele.InspectableCodeInfo,
where the current list of classes is consulted.
If the class of the method just compiled is in the list, it results in a
call to the empty method inspectableCompilationEvent() where the
Inspector can set a breakpoint.
Filtering only by class, not by method, results in some false positives,
but the mechanism is simple, fully synchronous, and reduces the
interruptions more than enough.
Inspector evolution
The Inspector’s life began long before the Maxine VM could run usefully, a period during which the novel meta-circular, highly modular architecture was refined and techniques for generating the Maxine boot image developed. The Inspector’s original role was static visualization and exploration of the binary boot image in terms of the higher level abstractions of the VM, something that could not be done by any existing tool.
As the VM became increasingly able to run through its startup (bootstrap sequence), basic debugging features were added: process controls and breakpoints, along with register and stack visualization. The Inspector remained monolithic (with no model/view separation) and single-threaded (the GUI froze during VM process execution).
As the VM began to execute application code, work on the Inspector proceeded incrementally along several fronts simultaneously:
- features on demand: as the VM became more functional and the concerns of the development team evolved, many more features were added: additional views of internal state, more debugging controls, more user options, etc. These were, and continue to be, demand-driven according to the needs of the project.
- UI functionality and consistency: the early window implementations were rewritten for code reuse and standardized around new conventions, the menu system was standardized and extended, Java Look & Feel compliance was added, and more.
- re-architecting internals: model/view separation was added, direct interaction among views was replaced by a user event model, change propagation was refined, generalized notion of user selection defined, etc.
Once model/view separation became explicit in the previously monolithic code base, the Inspector sources were incrementally split into two “projects” with distinct concerns:
- Tele: responsible for communicating with and managing the VM process, essentially being the keeper of the model of the VM’s state at any point during the session.
- Inspector: responsible for user interaction, state visualization, and command handling.
Dependence between the two projects eventually became one-way, but
remained complex: the Inspector project depends directly on many
implementation classes from both the Tele and VM projects.
A subsequent effort to further separate the two by re-engineering around
new, well-documented interfaces is only partially complete.
As the Inspector evolved into a heavily used debugger, demand grew for multi-threaded management of the VM process so that the GUI would remain live and in particular so that a user could interrupt (“Pause”) a running VM. Concurrent operation is now supported, but the retrofit (over complex, distributed interactions in the reading and modeling of VM state) is incomplete Occasional concurrency problems appear as the VM and Inspector evolve.